Friday, 3 May 2024, 4:26 AM
Site: iLearn - Lernmanagementsystem der Hochschule Deggendorf
Course: vhb Demo: English Competence and Research Training for Health Professionals_Alt (vhb Demo: English Competence and Research Training for Health Professionals_Alt)
Glossary: Glossary - Research Basics and Terminology
S

Sensitivity

(Last edited: Tuesday, 14 March 2017, 8:55 AM)
  • Measure of a test’s ability to correctly detect people with the disease
  • Sensitivity and specificity are inversely proportional: when sensitivity increases, specificity decreases and vice versa
  • Example: 

A sensitivity of 97.5% in mammography screening means that every woman with a tumor will be correctly detected in 97.5% of the cases. 2.5% might have a tumor, but cannot be identified through the screening.

Further information:  Understanding and using sensitivity, specificity and predictive values.

Example for using sensitivity in a study:
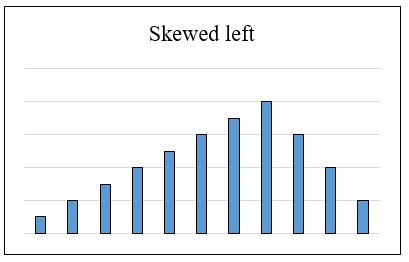
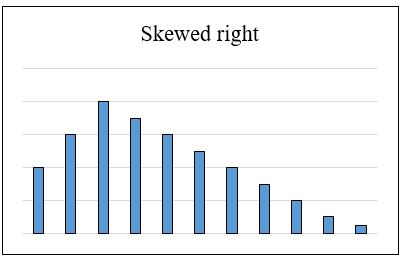
  Sensitivity and specificity of mammography and adjunctive ultrasonography to screen for breast cancer in the Japan Strategic Anti-cancer Randomized Trial (J-START): a randomised controlled trial. 

Skewed Distribution

(Last edited: Tuesday, 14 March 2017, 8:55 AM)

  • Asymmetrical shape of distribution
  • Types
  1. Skewed to the left: negative skew (long tail on the negative side of the tail)Skewed left
  2. Skewed to the right: positive skew (long tail on the positive side of the tail)skewed right


Specificity

(Last edited: Tuesday, 14 March 2017, 8:55 AM)
  • Measure of a test’s ability to correctly identify people who do not have the disease
  • Sensitivity and specificity are inversely proportional: when sensitivity increases, specificity decreases and vice versa
  • Example: 

A specificity of 95.0% in mammography screening means that 95.0% of the women tested are correctly identified as not having a tumor.

Further information:  Understanding and using sensitivity, specificity and predictive values

Standard Deviation

(Last edited: Tuesday, 14 March 2017, 8:55 AM)
  • Measure of the spread/dispersion of a set of observations
  • Square root of the variance
  • Formula:   s= \sqrt{(\sum\nolimits_{i=1}^n(x_i- \mu)^2)/(n-1) }
  • Example:

Set of numbers: 3,4,5,5,5,6,7


Statistically Significant

(Last edited: Tuesday, 14 March 2017, 8:55 AM)
  • Result that is unlikely to have happened by chance
  • It is assessed by the p-value