Glossary - Research Basics and Terminology
This glossary explains common terminology used in research articles. It helps you to understand the articles which are included in the following chapters of this course.
If you are looking for more terminology, the glossary of 'The Cochrane Collaboration' is a useful resource which you can find here.
Special | A | B | C | D | E | F | G | H | I | J | K | L | M | N | O | P | Q | R | S | T | U | V | W | X | Y | Z | ALL
N |
|---|
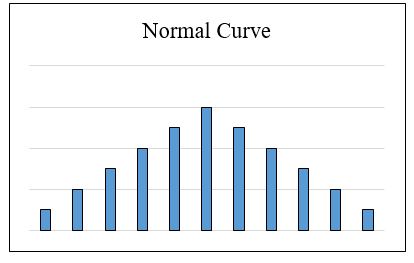
Normal Curve | |||
|---|---|---|---|
Normal Distribution | |||
|---|---|---|---|
| |||
Null Hypothesis (H0 or Ho) | |||
|---|---|---|---|
Number Needed to Treat (NNT) | |||
|---|---|---|---|
| |||
O |
|---|
Objectivity | |||
|---|---|---|---|
Interviewer A asks question to Patient X Interviewer B asks question to Patient X → Both answers will be the same (answer should be independent from the interviewer) | |||
Odds Ratio (OR) | |||
|---|---|---|---|
→ Patients who received the new antihypertensive drug die 3.7 times more often than patients who received an existing drug. → The odds to die with the new antihypertensive drug is 3.7 times higher than with the existing drug. Further information: Explaining Odds Ratios | |||
Ordinal Scale | |||
|---|---|---|---|
| |||
P |
|---|
Percentile | |||
|---|---|---|---|
50th percentile= 50% of all values in a distribution fall below this score
| |||
PICO | |||
|---|---|---|---|
P= Population I= Intervention (or diagnosis, prognosis) being evaluated C= Comparison (usually to gold standard or no treatment) O= Outcome Example: Is physical activity at least twice a week for more than ten minutes as effective as the antihypertensive X in preventing high blood pressure in adults over 18 years? P= adults over 18 years I= physical activity at least twice a week for more than ten minutes C= antihypertensive X O= prevention of high blood pressure | |||