Browse the glossary using this index

Special | A | B | C | D | E | F | G | H | I | J | K | L | M | N | O | P | Q | R | S | T | U | V | W | X | Y | Z | ALL

Page: (Previous)   1  2  3  4  5
  ALL

R

Risk Factor

(Last edited: Tuesday, 14 March 2017, 8:55 AM)
  • Aspect of a subject’s condition, lifestyle or environment that affects the probability of a disease to occur 
  • Example: obesity = risk factor for high blood pressure

S

Sensitivity

(Last edited: Tuesday, 14 March 2017, 8:55 AM)
  • Measure of a test’s ability to correctly detect people with the disease
  • Sensitivity and specificity are inversely proportional: when sensitivity increases, specificity decreases and vice versa
  • Example: 

A sensitivity of 97.5% in mammography screening means that every woman with a tumor will be correctly detected in 97.5% of the cases. 2.5% might have a tumor, but cannot be identified through the screening.

Further information:  Understanding and using sensitivity, specificity and predictive values.

Example for using sensitivity in a study:
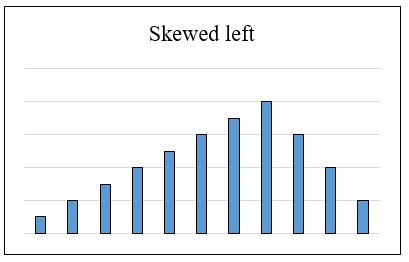
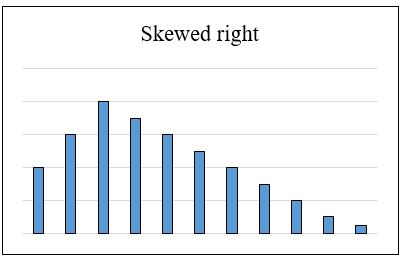
  Sensitivity and specificity of mammography and adjunctive ultrasonography to screen for breast cancer in the Japan Strategic Anti-cancer Randomized Trial (J-START): a randomised controlled trial. 


Skewed Distribution

(Last edited: Tuesday, 14 March 2017, 8:55 AM)

  • Asymmetrical shape of distribution
  • Types
  1. Skewed to the left: negative skew (long tail on the negative side of the tail)Skewed left
  2. Skewed to the right: positive skew (long tail on the positive side of the tail)skewed right


Specificity

(Last edited: Tuesday, 14 March 2017, 8:55 AM)
  • Measure of a test’s ability to correctly identify people who do not have the disease
  • Sensitivity and specificity are inversely proportional: when sensitivity increases, specificity decreases and vice versa
  • Example: 

A specificity of 95.0% in mammography screening means that 95.0% of the women tested are correctly identified as not having a tumor.

Further information:  Understanding and using sensitivity, specificity and predictive values


Standard Deviation

(Last edited: Tuesday, 14 March 2017, 8:55 AM)
  • Measure of the spread/dispersion of a set of observations
  • Square root of the variance
  • Formula:   s= \sqrt{(\sum\nolimits_{i=1}^n(x_i- \mu)^2)/(n-1) }
  • Example:

Set of numbers: 3,4,5,5,5,6,7


Statistically Significant

(Last edited: Tuesday, 14 March 2017, 8:55 AM)
  • Result that is unlikely to have happened by chance
  • It is assessed by the p-value

T

Type-I-Error (α-error)

(Last edited: Tuesday, 14 March 2017, 8:55 AM)


  • Incorrectly rejecting the null hypothesis
  • Concluding that there is a relationship when no relationship exists
  • Example: if α=0.01, then there is a 1% chance for an α-error
  • False Positive

Type-II-Error (β-error)

(Last edited: Tuesday, 14 March 2017, 8:55 AM)


V

Validity

(Last edited: Tuesday, 14 March 2017, 8:55 AM)
  • Degree to which a result is likely to be true and free of bias
  • Test is measuring what is needed
  • Accuracy of a test
  • Example:

An interview guideline for breast cancer experts contains questions about the topic "breast cancer". This guideline includes previously defined research questions regarding the topic so that it will help in answering the required questions. 

Further information: Understanding and using sensitivity, specificity and predictive values 


Variance

(Last edited: Tuesday, 14 March 2017, 8:55 AM)
  • Measure of variation shown by a set of observations
  • Sum of the squares of deviations from the mean divided by the number of observations minus 1 (because it is a sample)
  •  s^2=( \sum\nolimits_{i=1}^n (x_i- \mu)^2)/(n-1)
  • Example:

Set of numbers: 3,4,5,5,5,6,7


Page: (Previous)   1  2  3  4  5
  ALL