Module 2: How GIS works
2.2 Tasks of a GIS

|
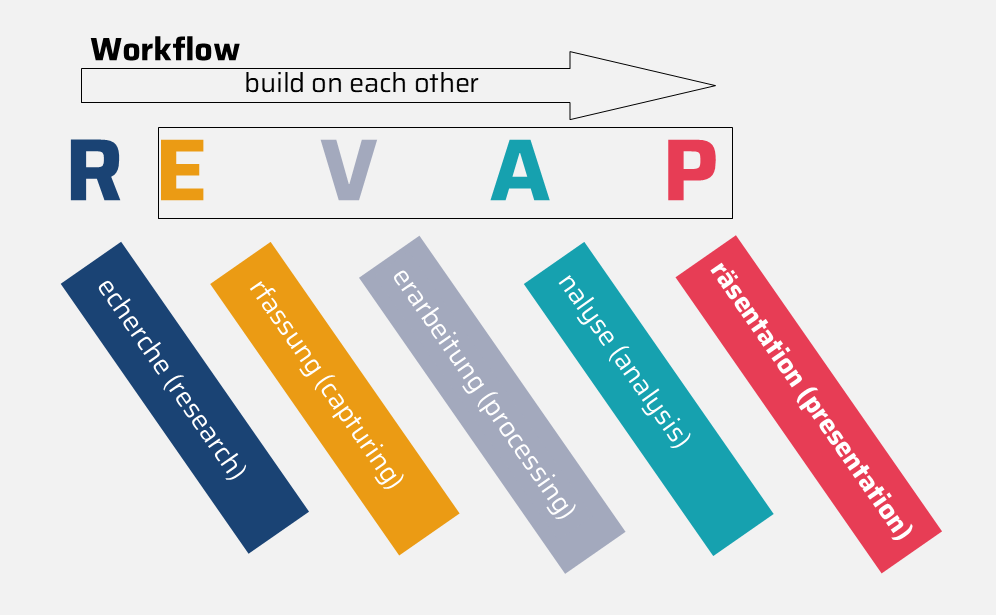
The EVAP principleThe various work steps, which are often complicated for beginners, can be summarised with the frequently quoted abbreviation EVAP (acquisition, processing, analysis and presentation), which has already been mentioned in the information systems. As already learnt in the previous module, this principle describes the scope of work and functions of a GIS, which can also be derived from the given definitions: from the input of necessary geodata to the diverse possibilities of data processing and analysis to the presentation of the results. Each function builds on the previous one. Accordingly, the steps reflect the chronological workflow of a standard GIS project. The process described in the school is supplemented by a preliminary data search (R), which is not necessarily carried out by the GIS programme itself, but is becoming increasingly important due to the rapid development of the geomarket. This REVAP process (see Figure 2.2.1) serves as a guideline for the course. It organises the individual chapters, in which the respective process section is then discussed in more detail.³
Figure 2.2.1: The EVAP principle with a ranged search (own illustration). |
 |
Erfassung/CapturingData processing first requires methods for data acquisition. These are traditional surveying and mapping. Empirical methods, remote sensing and data transfer are also conceivable. Sensors are increasingly being used to collect data on air quality, for example. Verarbeitung/ProcessingGeodatabase systems are used to store the collected geodata and make it available. This includes geometric and topological models, factual data and images of real worlds such as geoobjects (these are actually existing objects that can be clearly referenced using geodata). Analyse/AnalysisAn analysis tool is required to work with the databases. In the form of software or an application, it allows the geometric, topological, temporal or thematic analysis of geodata. Combined analyses are also conceivable. Quantity operations, intersections and spatial statistics help with the analyses. Präsentation/PresentationIn the end, interested parties primarily see the presentation of the geodata. This is a graphical user interface that allows communication between the user and the system. Here, communication between the user and the system is possible within the framework of interactive web apps and maps, tables or diagrams. |

|
QuizDie Geschichte des GIS besteht aus mehreren Etappen. Alles beginnt mit der Digitalisierung der Dateneingabe und -speicherung.
|

